Quantification of Hydrodynamic Forcing and Burial, Exposure and Mobility of Munitions on the Beach Face
Dr. Jack A. Puleo, Demetra Cristaudo (PhD candidate), Ben Gross (MCE student)
Sponsor SERDP (MR-2503)
The U.S. Army Corps of Engineers (USACE) has identified more than 400 locations within formerly used defense sites (FUDS) that contain unexploded ordnance (UXO) in the underwater environment (SERDP, 2010). UXO have also been found on many beaches (e.g. Assateague Island, MD; Surf City, NJ; Hapuna Beach, HI) and pose a major risk to the public. There is no a priori knowledge of when or where a munition may wash ashore or potentially, more importantly, what happens after the munition reaches the beach. The beach face is the region of the beach dominated by swash-zone processes and is alternately covered and uncovered by successive waves (Figure 1). Studies on the beach face are critical because munition migration rates are expected to be higher than elsewhere in the nearshore and migration may occur into areas that had been previously cleared. It is our understanding that no previous field studies have addressed the details of swash–zone hydrodynamics and munition mobility on the beach face. Thus, the proposed project addresses a major gap in understanding of munition mobility in the nearshore.
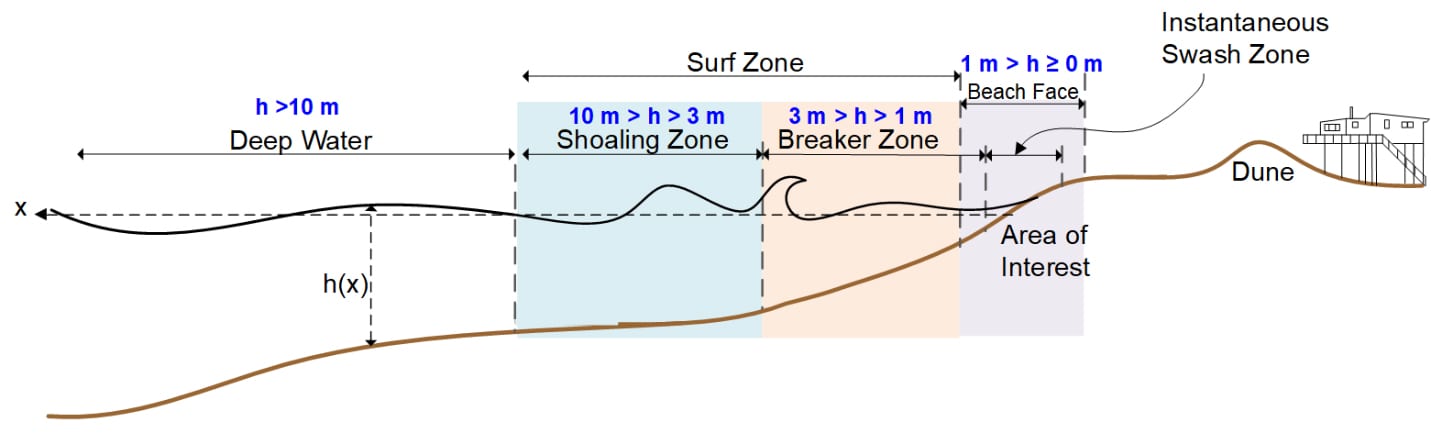
Figure 1. Schematic showing the nearshore with shoaling, breaker and swash zone regions. The area of interest (purple block) is known as the beach face or swash zone.
Our approach includes detailed, time-dependent field measurements of munitions mobility/burial and concurrent hydrodynamic and bathymetric conditions under a variety of forcing scenarios. Several technologies (overhead and side looking imagery, imagery from submerged cameras, global positioning systems [GPS] and inertial motion units) are used to quantify munitions mobility. Simultaneous measurements of the hydrodynamic forcing were obtained using current meters, velocity profilers and pressure transducers. Sediment transport conditions were quantified using an array of optical backscatter sensors and conductivity concentration profilers (the sediment concentration data are less of a priority at this stage of analysis). Instruments were mounted to rugged scaffolding frames pounded into the beach face.

Figure 2. Suite of surrogate and inert munitions used in the SERDP experiments. No scale is provided here, but the largest munitions are nearly 1 m long and have a mass of 41 kg.
We designed surrogate munitions (Figure 2) following military reports and measurements off inert items from the repository at the Aberdeen Test Center. Designs were completed in CAD with an emphasis on maintaining the munition (shape, size, density, center of gravity and rolling moment of inertia). Errors between true and designed munitions were generally kept below 10% and this value is considered sufficient considering the range of variability in a particular munition type. Larger surrogates were outfitted with internal sensors such as inertial motion units, pressure sensors or photocell arrays to help identify migration and burial.
We have conducted two experiments in a large-scale laboratory facility in collaboration with the Aberdeen Test Center in Aberdeen, MD and two experiments in collaboration with the NASA Wallops Flight Facility in Wallops Island, VA. Preliminary results from the laboratory studies (Figure 3) show migration is related to a forcing parameter (Shield number as a ratio of destabilizing to stabilizing forces). Object burial can be partially predicted through relation to the Keulegan-Carpenter number that relates drag to inertia forces (Figure 4). Further data analysis is underway by the two students working on the project with results to be presented at the SERDP Symposium and the Fall AGU Meeting.
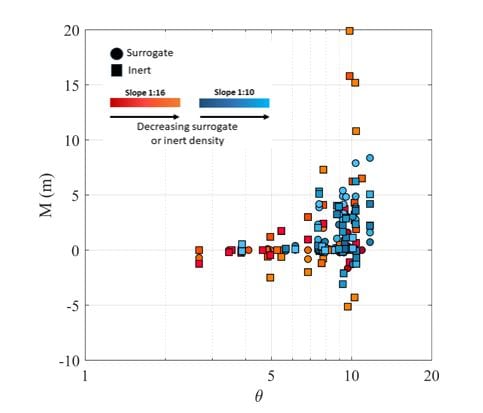
Figure 3. Migration distance after roughly 5 minutes of wave forcing during large-scale laboratory studies. Positive is offshore. Negative is onshore.
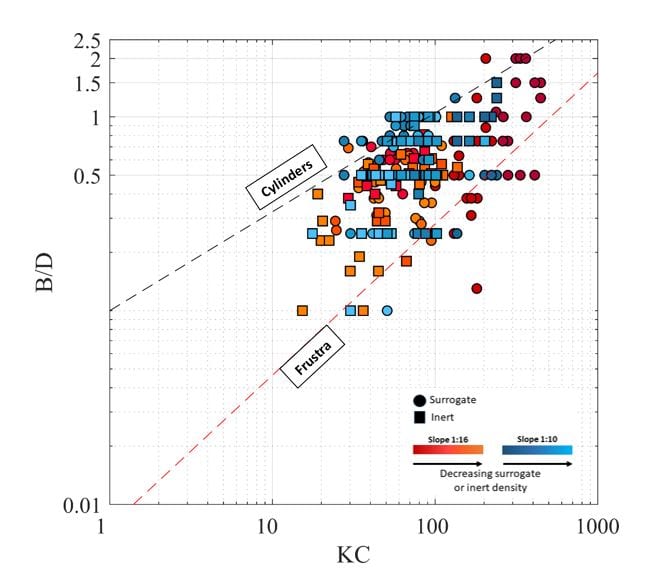
Figure 4. Relative burial depth as a function of the Keulegan-Carpenter number. The dashed lines are empirical relationships for equilibrium scour (Friedrichs et al., 2016).