
In situ hydrodynamic and morphodynamic measurements during extreme storm events
1Stanford J. Borrell and 2Jack A. Puleo (excerpted from Shore and Beach)
INTRODUCTION
The East Coast of the United States of America is heavily impacted by extreme storm events which result in property damage, reduced ecosystem function, and the loss of life. The state of Delaware, where the study described herein occurred, is vulnerable to extreme storm events in the form of hurricanes and nor’easters as well as less extreme, yet still energetic, storm events. Focusing on extreme storm events, the meteorological behavior and resulting impact vary between hurricanes and nor’easters. Furthermore, no geographical location in Delaware is farther than 12.9 km (8 miles) from tidal waters (Runkle et al. 2017) and the Delmarva coast was found to be the most vulnerable area on the U.S. East Coast to storm-induced erosion (Zhang et al. 2001). The Delaware coast is generally void of offshore sandbars (Roberts et al. 2013), therefore the beach face acts as a ‘first line of defense’ against storms while dunes act as a ‘last line of defense’ to protect coastal infrastructure. In this paper, various in situ sensors were deployed to quantify the hydrodynamic forcing and resulting beach response during an extreme and energetic storm event at Bethany Beach, Delaware.
STORMS
The Delmarva Peninsula was affected by a month-long (March 2018) winter event dubbed “The Four’easters”, as there were four nor’easter storm events. In situ data were collected during the first of these four nor’easters, Nor’easter Riley (Figure 1), from 02 March 2018–05 March 2018. The storm lasted over multiple high tides and occurred during spring tides. The Delaware coast experienced flooding in coastal towns during high tides and coastal erosion was observed. The peak storm surge from Nor’easter Riley measured at NOAA tide gauge 8557380 in nearby Lewes, Delaware (Figure 2) was 0.91 m. A maximum significant wave height of 4.16 m, wave periods ranging from 11 s – 14 s, and wave direction ranging from 50º-90º relative to north (NBDC 44009, Figure 2) were measured.

Figure 1. Satellite image of Nor’Easter Riley.

Figure 2. Image showing location of study area.
STUDY SITE
The field study was conducted at Bethany Beach, Delaware (Figure 2). Bethany Beach is east facing and undergoes periodic berm-dune re-nourishment projects led by state and federal agencies. The tidal pattern is semi-diurnal, the mean oceanic tidal range is 1.24 m (classified as microtidal; (Whitfield and Elliott 2011) and the pre-Nor’easter Riley intertidal beach slope (defined from MHHW to MLLW) was 0.07 (1:14) suggesting an intermediate beach state (Wright and Short 1984). The mean sediment grain size at this location is classified as medium sand (~0.3 mm) and well-sorted (Ramsey 1999). Figure 3 shows the pre-Nor’easter Riley bathymetry, subaerial beach profile, tidal datums, and station locations for the Nor’easter Riley field study.
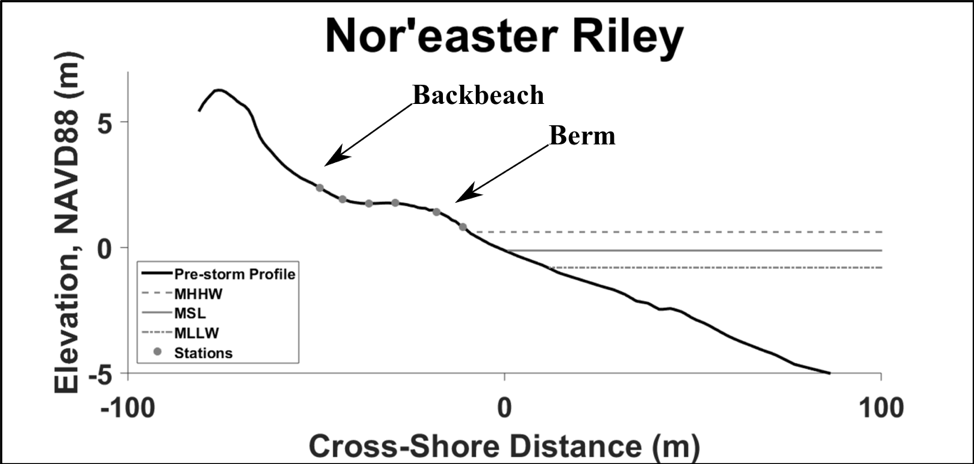
Figure 3. Pre-storm bathymetry and sensor locations.
METHODS
Deployment Technique
Several sensors were mounted to scaffold pipes at six deployment stations in a single cross-shore transect. The cross-shore transect extended from seaward of the pre-storm berm to the dune toe and each station was spaced 5 – 10 m apart (Figure 4a). The scaffold pipes were water-jet driven 2 m below the pre-storm bed level. Fins were welded to the bottom of 3 – 3.65 m monopoles to prevent rotation from hydrodynamic forces during the storm.

Figure 4. Stations deployed from monopoles during the study.
Sensor Description
The sensors used during the deployment are shown in Figure 5. A Banner Acoustic Distance Meter (ADM) uses ultrasonic sound waves and the speed of sound in air to measure distance at a sampling rate of 4 Hz. In this application, the measured distance corresponds to either water (when the area below the sensor is submerged) or bed (when the area below the sensor is exposed) elevation. JFE Advantech Electro-magnetic Current Meters (EM) were used to measure horizontal water velocity at a single elevation at a sampling rate of 5 Hz. RBR Pressure Sensors (RBR) were used to measure water depth at sampling rates of 16 Hz and 2 Hz, depending on cross-shore location.
All of the sensors are self-logging and self-powered, meaning that no cabling back to an external data logging system or power source was required. This approach was taken to facilitate a rapid-response deployment where station installation and sensor deployment was complete within hours of arrival to the study site. The EMs and RBRs were adjusted at every day-time low tide to compensate for bed elevation changes. The EMs were adjusted to a distance of 0.1 m above the bed and the RBRs were adjusted to the bed level.

Figure 5. Schematic of station deployment.
RESULTS
Bed & Water Elevations
Example ADM measurements during Nor’easter Riley are shown in Figures 6a. and 6c. Figure 6a. shows the time series of water (blue) and bed (magenta) elevations from Nor’easter Riley during a large erosive event at Station C on 03 March 2018. Figure 6c. shows a 10-minute segment of the time series from Figure 6a. The measured ADM distance was converted to elevation (NAVD88) through pre-storm bed elevation surveys at sensor locations.
A modified algorithm (Turner et al. 2008) was applied to ADM data to identify bed elevation during the storm event. Here, the bed was defined as the measured distance changing at a rate less than 2 mm/s during a time span of 1 s suggesting a relatively constant distance measurement within the sensor accuracy. The identified discrete bed elevations were low pass filtered to obtain a continuous bed elevation signal (solid black line, Figures 6a. and 6c.).

Figure 6. a,b) Elevation for water level and bed level from ADM. c,d) Cross-shore velocity from the JFE sensor.
The wave forcing (i.e. wave height, storm tide, storm surge and wave period) and relative bed elevation change measured at each cross-shore station during the storm event are shown in Figure 7 (Nor’easter Riley). The mean significant wave height, mean peak period, mean storm surge, and maximum storm tide elevation during each tidal cycle of the storm events are listed in Table 1 (Nor’easter Riley). It should be noted that the shortened duration of measured relative bed elevation change during Nor’easter Riley (Figure 7c.) at Stations B-D was due to structural failure of the deployed monopoles. Unfortunately, data from Station A was unrecoverable due to water damage.
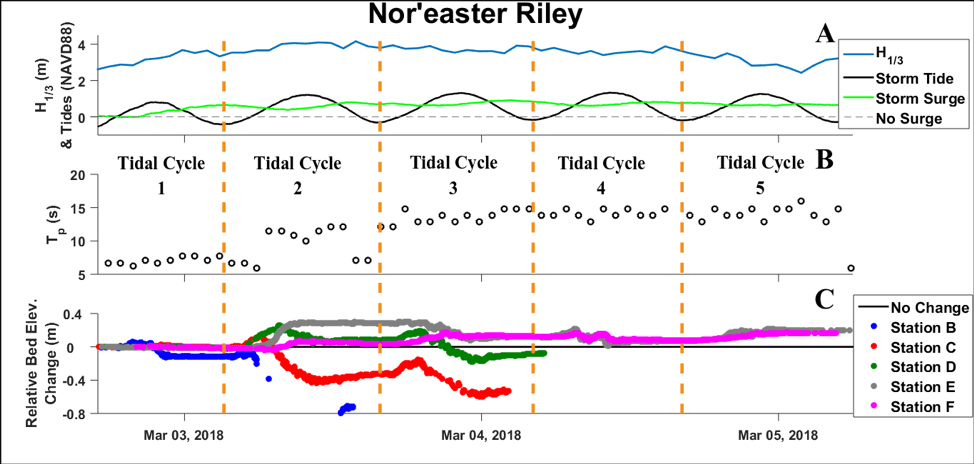
Figure 7. Wave forcing (A), wave period (B) and relative bed level change (C) during Nor’Easter Riley.
The largest measured morphodynamic change occurred during tidal cycles 2 and 3 (Figure 7c.) where the greatest mean significant wave heights were recorded at 3.87 m and 3.74 m, respectively. Nor’easter Riley began to impact the beach during tidal cycle 2 when the mean storm surge and maximum storm tide elevation difference relative to the previous tidal cycle was the greatest (Table 1). The amount of erosion measured at the stations located on the pre-storm berm (Stations B and C) was 0.4 m – 0.8 m while 0.05 m – 0.3 m of accretion was measured at more landward stations (Stations D-F). Erosion was measured at more landward stations (Stations D and E) during tidal cycle 3 compared to tidal cycle 2, despite a decrease in mean significant wave height. However, there was an increase in mean peak period, mean storm surge, and maximum storm tide elevation (Table 1). Erosion was measured for the first time at Station F during tidal cycle 4, while accretion was measured on the backbeach at Stations E and F during tidal cycle 5. The maximum mean peak period occurred during tidal cycles 4 and 5 (Table 1).
The beach face slope continuously steepened throughout tidal cycles 2 – 4. The beach face slope for tidal cycles 2 and 3 was calculated using the measured bed elevations from Stations C and F. For tidal cycle 4, the slope was calculated using the cross-shore GPS profiles (Figure 8a.) due to lack of ADM measurements. The initial beach face slope was 0.041 (1:24) and became the steepest following tidal cycle 3 with a slope of 0.075 (1:13). The final beach face slope after tidal cycle 5 was 0.07 (1:14).
|
Table 1. |
||||
|
Wave forcing conditions during Nor’easter Riley for each tidal cycle |
||||
|
Nor’easter Riley |
<H1/3> (m) (Difference Relative to Previous Tidal Cycle, m) |
<Tp> (s) (Difference Relative to Previous Tidal Cycle, m) |
<Storm Surge> (m) (Difference Relative to Previous Tidal Cycle, m) |
Max Storm Tide (NAVD88, m) (Difference Relative to Previous Tidal Cycle, m) |
| Tidal Cycle 1 | 3.24 | 7.08 | 0.28 | 0.82 |
| Tidal Cycle 2 | 3.87 (0.63) | 9.40 (2.32) | 0.59 (0.31) | 1.21 (0.39) |
| Tidal Cycle 3 | 3.74 (-0.13) | 13.6 (4.2) | 0.75 (0.16) | 1.32 (0.11) |
| Tidal Cycle 4 | 3.61 (-0.13) | 14.1 (0.50) | 0.73 (-0.02) | 1.35 (0.03) |
| Tidal Cycle 5 | 3.04 (-0.57) | 14.1 (0) | 0.68 (-0.05) | 1.28 (-0.07) |
| Brackets (<>) denote time averaged values. H1/3 and Tp are from NBDC 44009, storm surge and maximum storm tide data are from NOAA tide gauge 8557380. | ||||

Figure 9. Morphology during Nor’Easter Riley from GPS measurements.
Velocities
Cross-shore velocity measurements at Station C are shown in Figures 6b. and 6d. The velocity time series are discontinuous due to intermittent emergence and submergence of the EM sensor in the swash zone. The determination of sensor emergence (submergence) was necessary to eliminate (retain) raw velocity data points. This determination was made using the measured water elevations by the ADM. Sensor burial also had to be determined to eliminate or retain raw velocity data points. The continuous bed elevation signal was used to make this determination. Maximum uprush velocities exceeding 4 m/s, corresponding to a rapid rise in water level, were measured during the storm event. Backwash velocities were often truncated or not recorded as the water level fell below the sensor elevation. No velocity measurements at the landward stations (C – F) were recorded during pre-storm conditions.
GPS Survey Profiles
A Leica real-time kinematic global positioning system (RTK GPS) was used to measure cross-shore elevation profiles (Figure 9) of the beach face at every day-time low tide. All GPS profiles were captured in UTM zone 18 and relative to the vertical datum NAVD88. The measured profiles provided spatially continuous elevation data of the beach face evolution. Maximum sand volume changes of 17.8 m3m-1 (Nor’easter Riley) were calculated using the GPS beach face profiles. The measured profiles were also used to confirm ADM measurement accuracy where station averaged root-mean square error values of 0.03 m were calculated.
DISCUSSION
A primary goal of these field studies was to continuously measure the bed elevation throughout a storm event. The RTK GPS profiles are useful in that they are spatially continuous but fail in providing temporally dense beach elevation change, as there is approximately a 12-hour interval between each collected profile and important morphodynamic processes may not have been measured. For example, accretion occurred at seaward stations as swash processes began (i.e. station became wet) before erosion would occur (Figure 7c., tidal cycles 2 and 3 and Figure 8c., tidal cycles 3 and 4). Quantifying these changes required measurements at higher frequency than standard GPS surveying approaches.
Morphodynamic change occurred when the offshore significant wave height and wave period increased from pre-storm conditions (Figures 7 and 8). The time during the tidal cycle also played a major role, as most morphodynamic change occurred during the rising tide and at peak high tide. Erosion at the most seaward stations and accretion at the most landward stations were simultaneously measured during the storm event (Figure 7c., tidal cycle 2 and Figure 8c., tidal cycle 3), suggesting that both divergent and convergent cross-shore sediment transport occurred.
Whether erosion or accretion was measured at a cross-shore location was dependent on the storm wave forcing and the severity of berm erosion. When the berm eroded, the beach became steeper, allowed for greater vertical run-up (Stockdon et al. 2006) to occur, and induced morphodynamic change on the backbeach. The effect of berm erosion preceding backbeach morphodynamic change was observed during the storm event (Figure 7c., tidal cycle 3 and Figure 8c., tidal cycle 5), despite a decrease in mean significant wave height. An increase in wave period was important to cross-shore morphological change as longer waves were able to penetrate to the backbeach. The morphodynamic feedback of berm erosion preceding backbeach morphodynamic change, coupled with larger wave heights and wave periods compared to pre-storm conditions, is important in assessing the risk posed to dune systems and coastal infrastructure.
SUMMARY
In situ field data were collected during an extreme storm event (Nor’easter Riley) at Bethany Beach, Delaware to further understanding of the hydrodynamics and morphodynamics that occur across the beach face during storms. The field study demonstrated the ability to successfully collect in situ field data during storm events and to identify limitations. While the effects of storm wave forcing on beach erosion is well known, berm erosion proved to also be an important factor to backbeach vulnerability. Morphodynamic change was measured at the more landward deployment stations following berm erosion coupled with increased wave heights and wave periods compared to pre-storm conditions. These types of in situ field data are fundamental in understanding the complexity of beach response to extreme forcing, which in turn will improve predictive numerical models (e.g. XBeach, CShore) and coastal management decisions.
ACKNOWLEDGMENTS
This work was supported by Delaware Sea Grant (NA18OAR4170086), the United States Coastal Research Program (W912H18P0124) and the University of Delaware. The full paper is “in press” in Shore and Beach. We thank Cliff Graviet and John Apple of Bethany Beach for site access and logistics support. Demetra Cristaudo, Ben Gross, Michael Larner, Sravani Mallavarapu, Rory O’Boyle, Yashar Rafati, Rachael Schaefer, Liangyi Yue, and Tingting Zhu assisted in field deployment and data collection efforts in unfavorable conditions.
REFERENCES
Roberts, T.M., Wang, P., and J.A. Puleo, 2013. “Storm-driven cyclic beach morphodynamics of a mixed sand and gravel beach along the Mid-Atlantic Coast, USA.” Marine Geology, 346, 403–421. https://doi.org/10.1016/j.margeo.2013.08.001.
Runkle, J., Kunkel, K., Easterling, D., Frankson, R., Champion, S., Stewart, B., Sweet, W., Leathers, D., and A.T. DeGaetano, 2017. “Delaware State Climate Summary.” NOAA National Centers for Environmental Information, available at https://statesummaries.ncics.org/de/
Turner, I.L., Russell, P.E., and T. Butt, 2008. “Measurement of wave-by-wave bed-levels in the swash zone.” Coastal Engineering, 55(12), 1237–1242. https://doi.org/10.1016/j.coastaleng.2008.09.009.
Whitfield, A. and M. Elliott, 2011. “Ecosystem and Biotic Classifications of Estuaries and Coasts.” In Treatise on Estuarine and Coastal Science, pp. 99–124.
Wright, L.D. and A.D. Short, 1984. “Morphodynamic Variability of Surf Zones and Beaches: A Synthesis.” Marine Geology, 56, 93–118.
Zhang, K., Douglas, B.C., and S.P. Leatherman, 2001. “Beach Erosion Potential for Severe Nor’easters.” Journal of Coastal Research, 17, 13.